DAVIS Challenge Interactive Track
In this section we are going to explain in more detail how the Interactive Track of the DAVIS Challenge works. Find more information in this publication.
Dataset
The interactive track is built on the DAVIS 2017 dataset. The video sequences in the train, val and test-dev subsets have been manually annotated with scribbles. The annotators were instructed to label all objects of a sequence in a representative frame (not necessarily the first frame of the sequence as in the semi-supervised track).
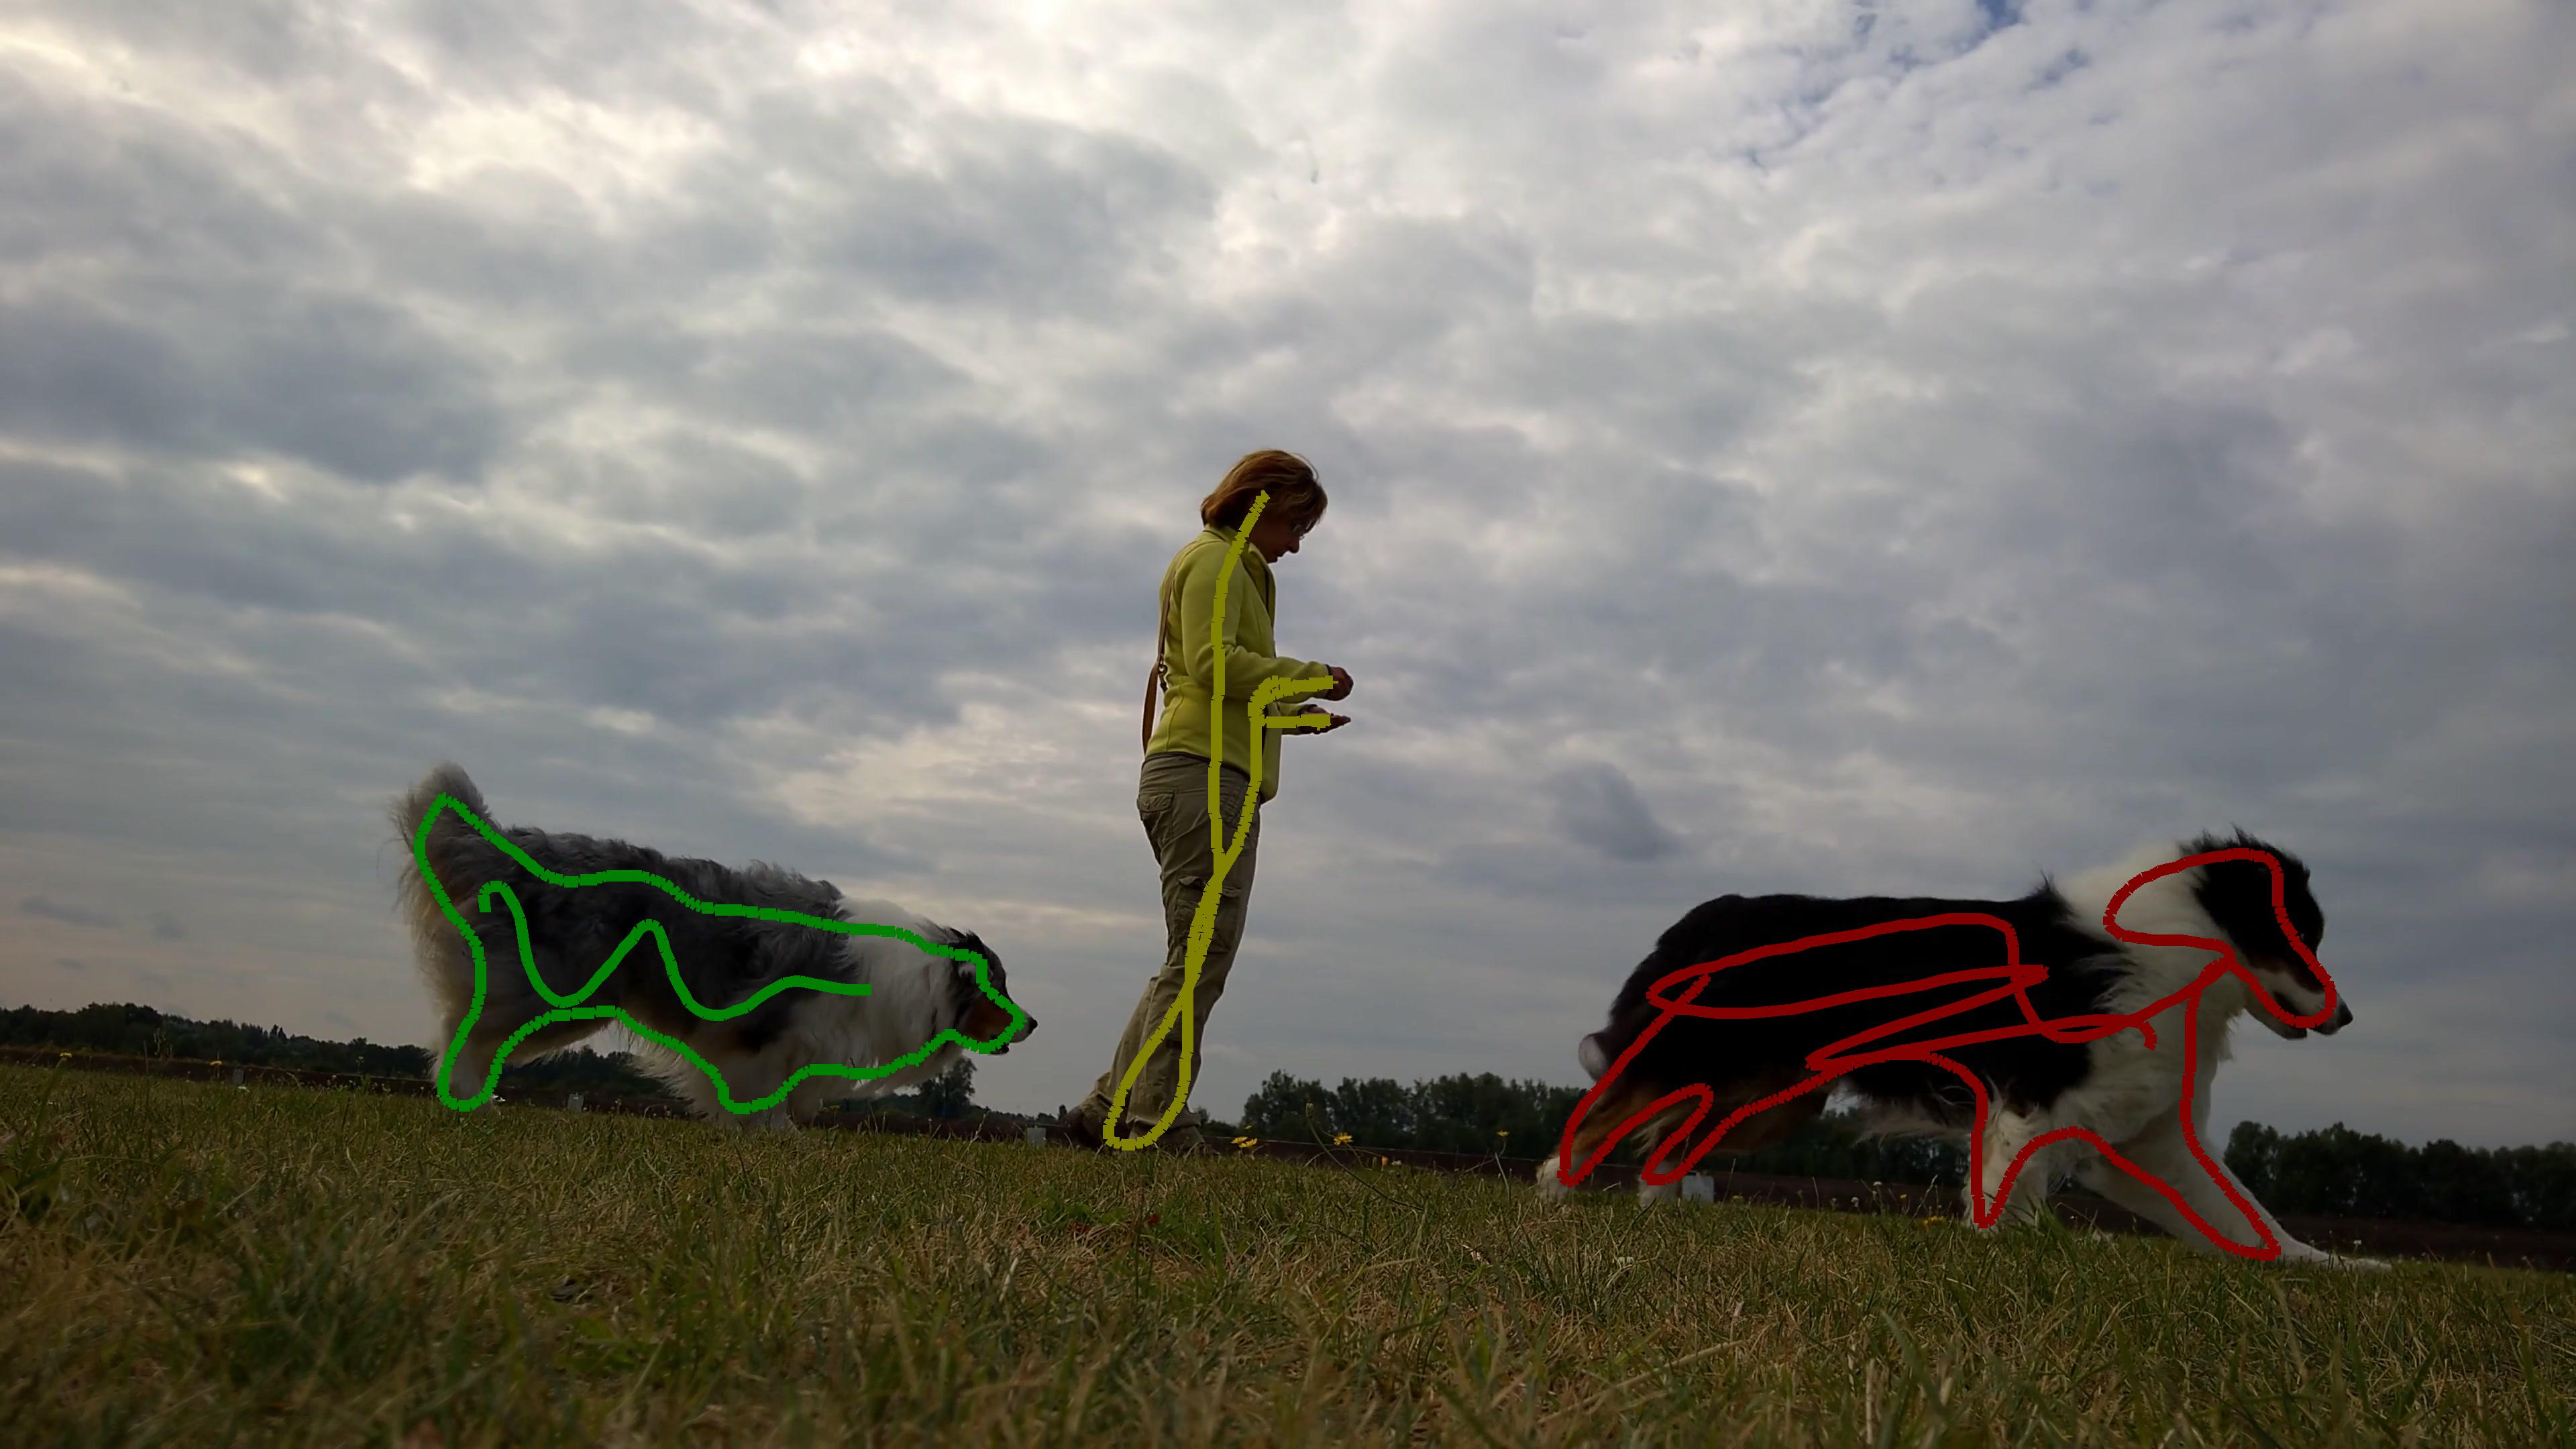
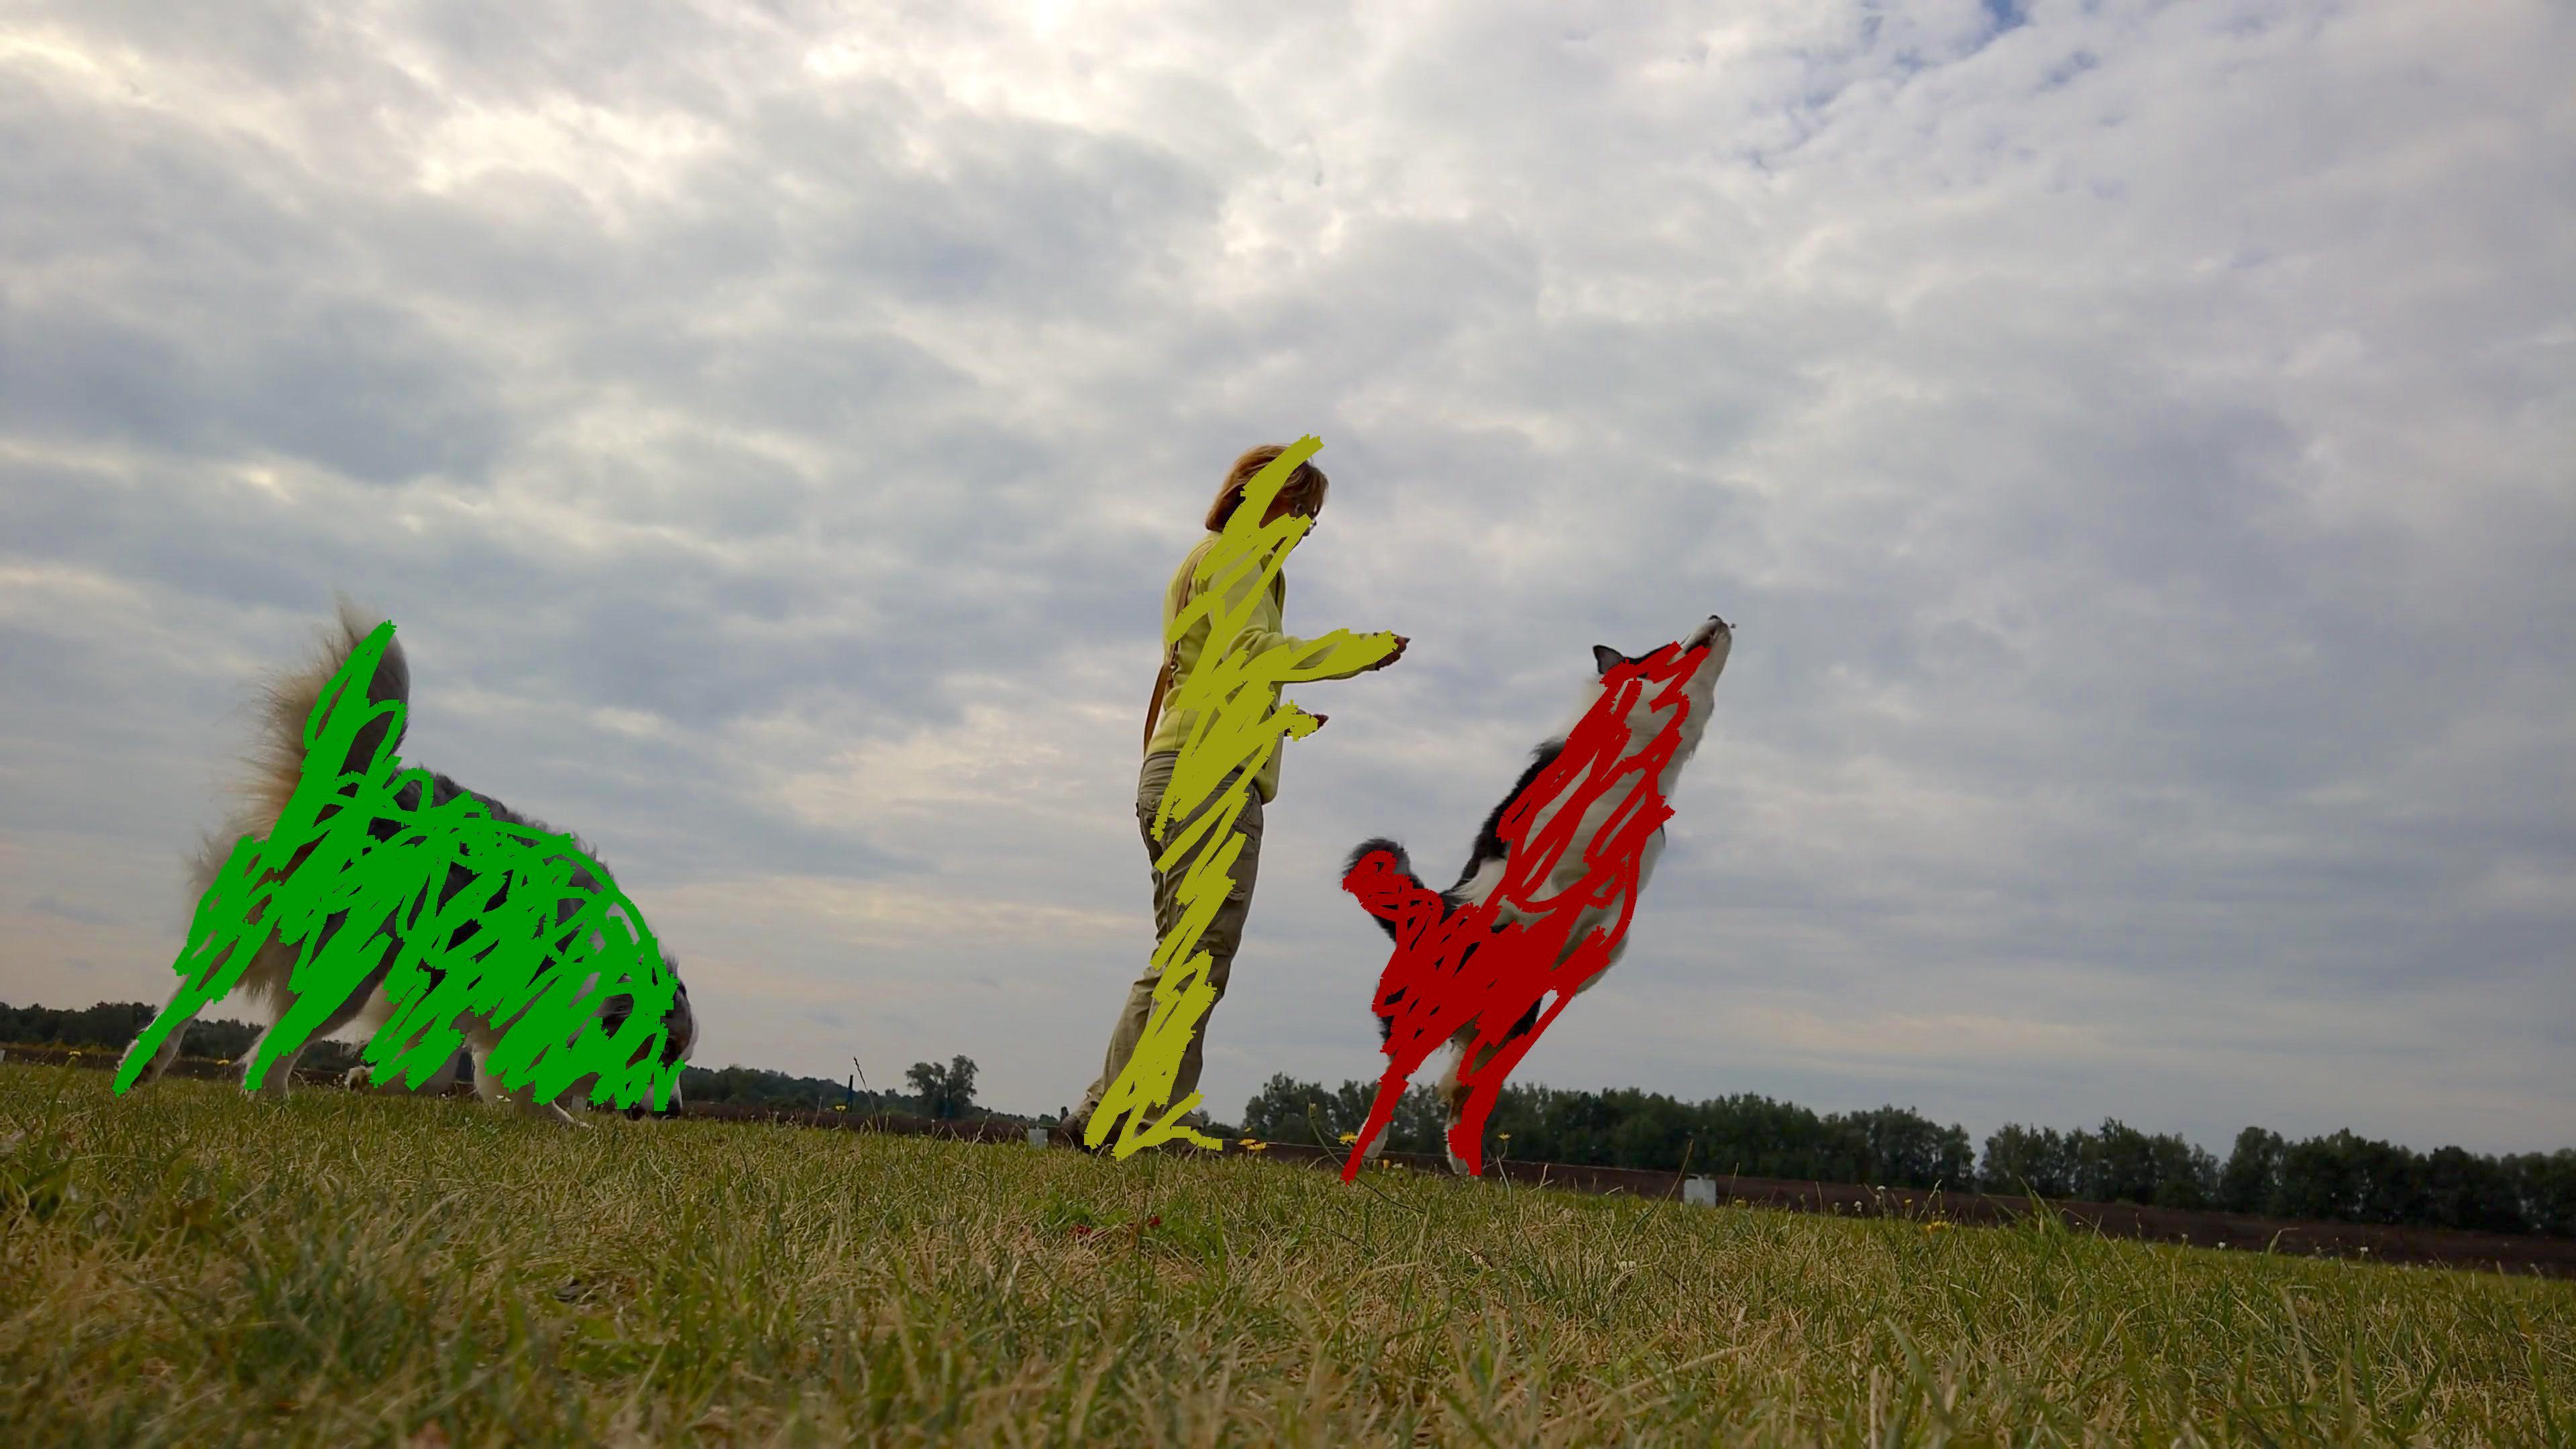
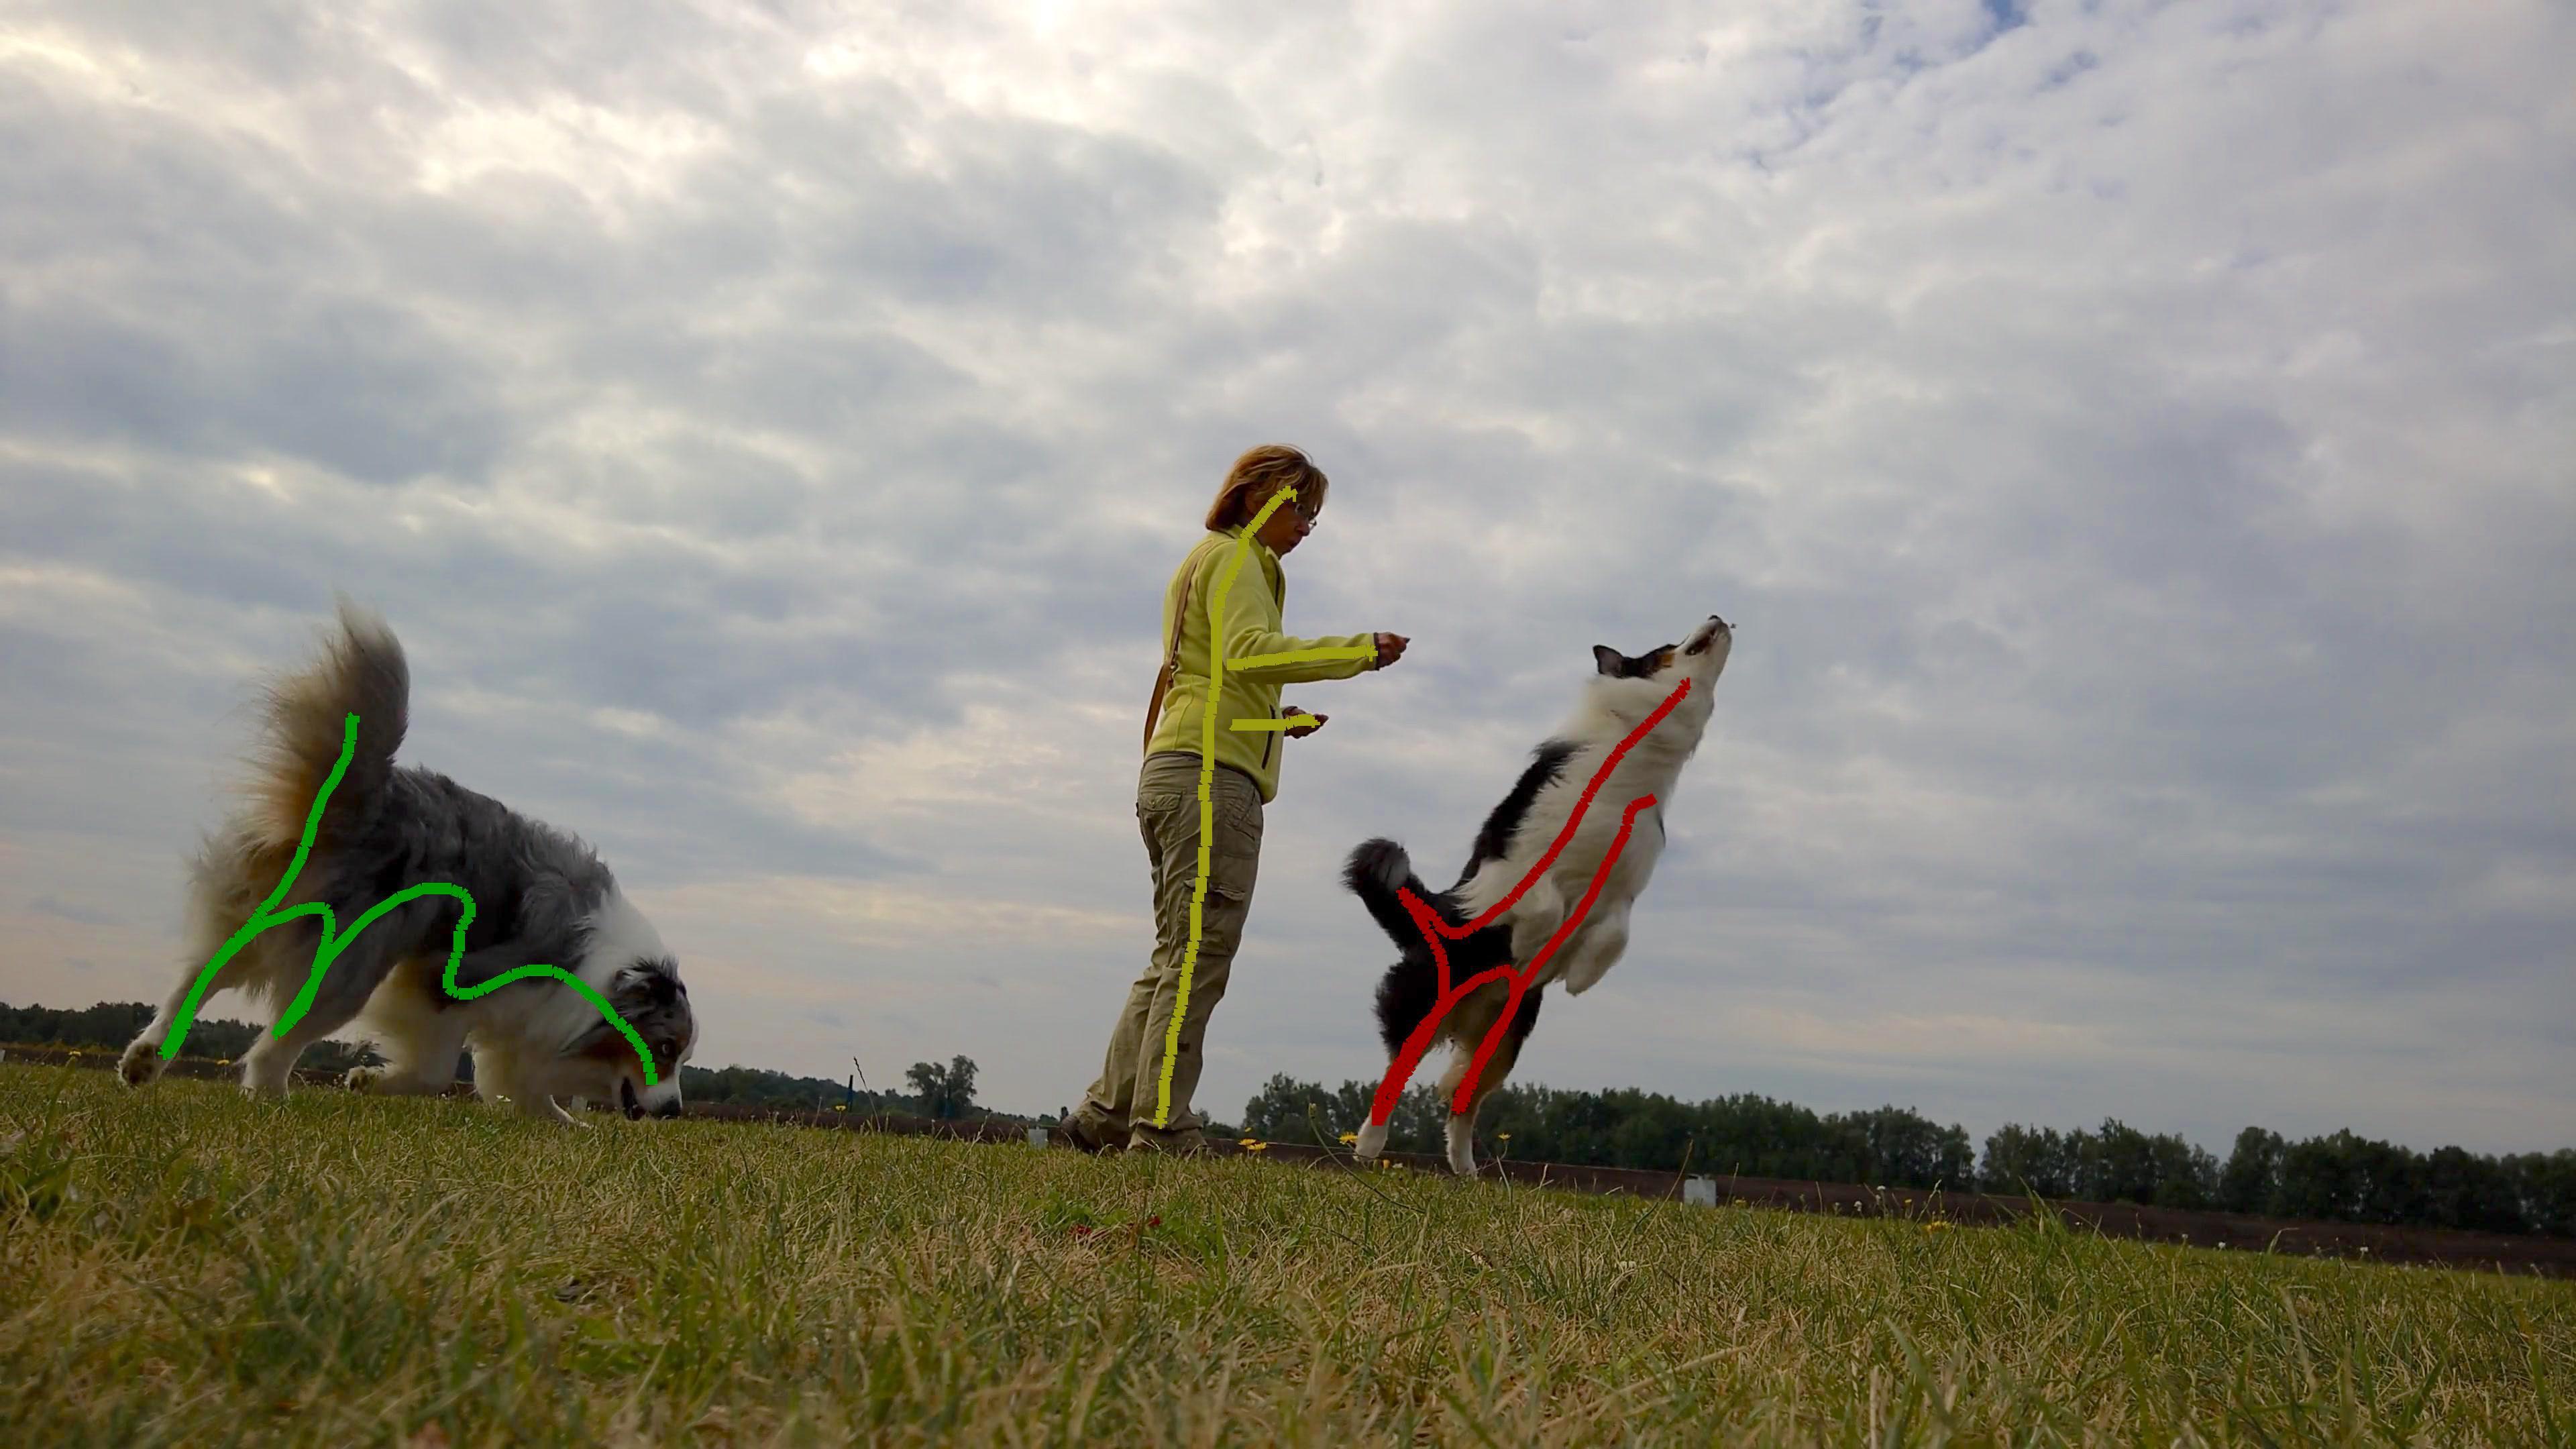
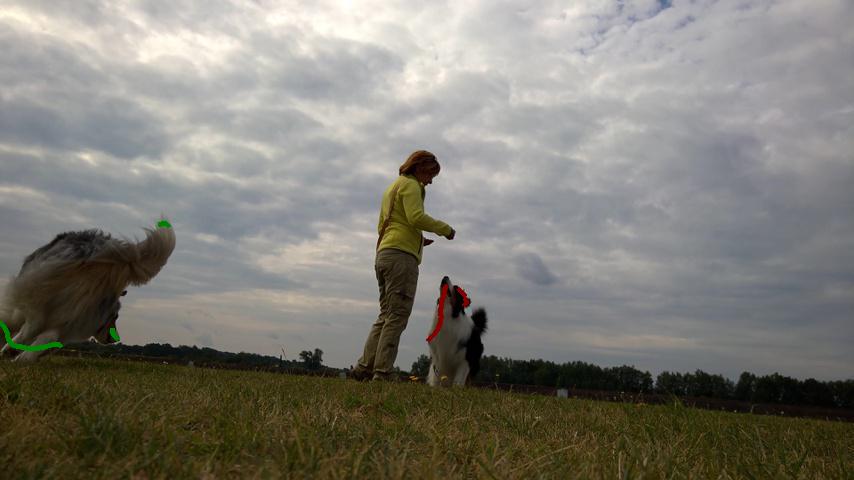
For every sequence in the train, val and test-dev subsets of DAVIS 2017, there are 3 different sets of scribbles annotated by different users. The figure below illustrates an example of three different user annotations on the same sequence dogs-jump. Note that annotations were performed on different frames, chosen by the respective users. More information on how to download the scribbles in the Installation guide.
Workflow
The aim of this challenge is to evaluate interactive models that can provide high quality segmentation masks, using scribbles and multiple interactions. Scribbles are a realistic form of supervision when it comes to video object segmentation, as they can be obtained much faster than full segmentation masks.
The workflow to evaluate these interactive models is as follows. To start, a video sequence and a scribble for each object in a certain frame is given to the user.
Note
Since there are 3 annotations per each sequence, the same sequence is evaluated multiple times, starting from different human annotated scribbles.
Then, the user's model has to predict the segmentation masks for all the frames in the sequence, taking into account the given scribbles. As timing is important, the time taken to perform this prediction is measured. After that, the user submits the predicted masks to a server that returns a new set of scribbles for this sequence, simulating a human interaction. The returned scribbles are all in the frame with the worst prediction from a list of frames specified by the user (by default all the frames in the sequence).
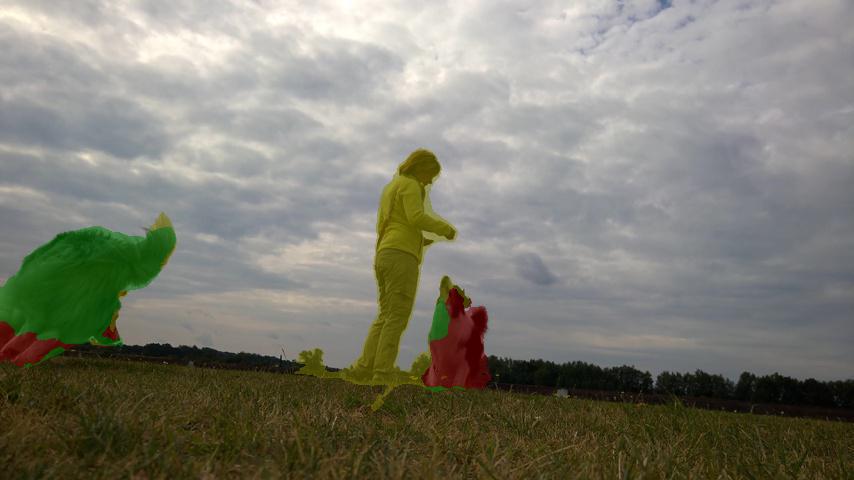
In the following images, we show an example of the simulated human interaction. In the left, the mask predicted by the method given the scribbles from the previous interaction(s) is shown. Once the results are submitted and the frame with the worst performance is computed, the additional set of scribbles generated is shown in the right image. The robot focuses on the areas where the prediction error is the highest and tries to give feedback, as a human would do. These scribbles can either be in false positive or false negative regions.
The additional scribbles given to the user should be used by his/her model to estimate again the masks. This procedure is repeated until a maximum number of interactions or a timeout is reached. The timeout is proportional to the number of objects in the sequence.
Example
If the maximum number of interactions is set to 8, and the timeout to perform all interactions is 240s, this leads to a maximum time of 30 seconds per interaction. However, the timeout is proportional to the number of objects in the sequence. Thus the timeout for a sequence with a single object (eg. blackswan) will be 30s per interaction, while for a sequence with 10 objects (eg. salsa) the limit is set to 300s. This behaviour favours models for which the prediction time is proportional to the number of objects in the sequence.
Local
This framework also provides the possibility to evaluate the methods locally. Local evaluation is possible only for the train and val subsets.
Remote
Failure
The remote evaluation server for the challenge is unavailable until the next edition (5th May 2019 23:59 UTC - 24th May 2019 23:59 UTC.).
In order to submit results to the interactive challenge, this framework allows to evaluate models agains a remote server. For remote evaluation, only the test-dev subset is available and the results are used for the ranking of the challenge.
In order to participate to the challenge a registration is required. To register, please go to https://server.davischallenge.org and fill in the form with your information. A mail will be sent to the provided email with a user key required for the remote evaluation. This key should be introduced in your code in order to identify your submissions. See the Usage guide for more details.
In addition, when the evaluation session has finished and a global sumary of the session has been generated, a session ID is given to the user. This session ID allows users to identify their run and show it in the leaderboard.
Evaluation
The evaluation metric used to evaluate the predicted masks is the mean of the Region similarity \mathcal{J} and the Contour Accuracy \mathcal{F} (more information of the metrics here). The time that each method takes to make a prediction is also taken into account. The average \mathcal{J}\&\mathcal{F} for all objects and for all starting scribbles is reported in every interaction. We are aware that some models may hit the timeout and not reach the maximum number of interactions. In this case, for every sample with missing interactions, the evaluation of these particular interactions is the same as the last interaction performed with 0 time cost.
Note
For the challenge, the maximum number of interactions is 8 and the maximum time is 30 seconds per object for each interaction (so if there are 2 objects in a sequence, your method has 1 minute for each interaction). Therefore, in order to do 8 interactions, the timeout to interact with a certain sequence is computed as 30*num_obj*8. If the timeout is reached before finishing the 8 interactions, the last interaction will be discarded and only the previous will be considered for evaluation.
At the end, a curve showing \mathcal{J}\&\mathcal{F} as a function of Accumulated Time is generated. In the following example you can see an example of how the curve looks like for a baseline method Scribble-OSVOS:
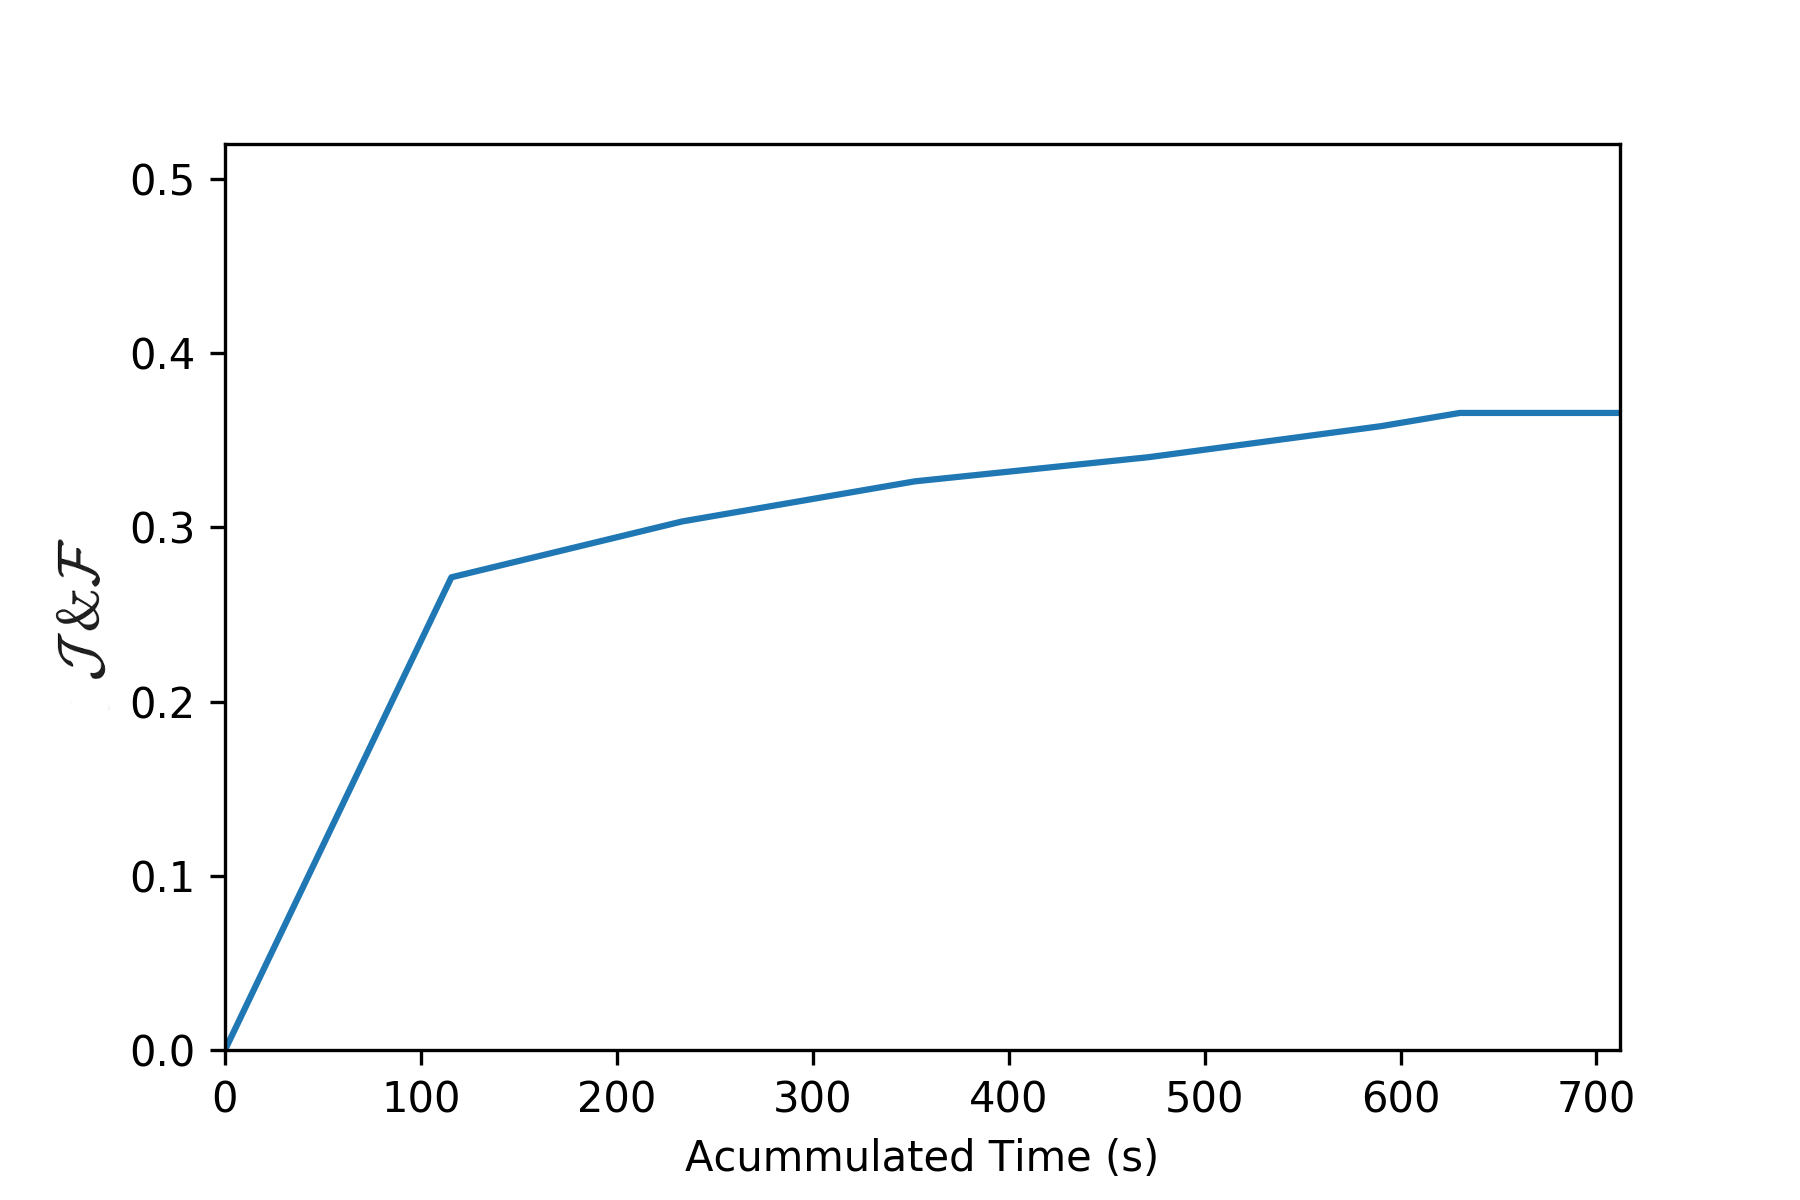
Given this curve, two parameters are extracted to rank the user's models in order to compare them:
-
AUC: Area under the curve. The area under the previous curve will be computed and normalized by the total available time.
-
\mathcal{J}_{60s}: \mathcal{J}\&\mathcal{F} at 60 seconds. This metric will be computed performing a interpolation of the previous curve at 60 seconds. This will encourage the users to implement and test fast models capable of giving good predictions in a short time.